
The numbers behind Bermuda Shorts Day 2018’s near-$100,000 deficit
By Matty Hume, July 12 2018 —
At the July 3 meeting of Students’ Legislative Council, Students’ Union vice-president operations and finance Kevin Dang reported a $98,000-plus loss from the 2018 Bermuda Shorts Day event.
We sat down with Dang to gain a better understanding of BSD 2018’s expenses, revenues and total loss. Here’s a breakdown of the event that cost the SU $98,646.87.
The expenses for BSD 2018 totaled to $153,359.83. This was slightly mitigated by a total revenue of $54,712.96, ultimately resulting in the $98,646.87 deficit. Dang divided the total expenses into eight categories, which are broken down as follows.
Security and medical services take the biggest slice of the pie
The cost of contracting security and medical services for BSD 2018 amount to 34 per cent of the SU’s expenses, or approximately $52,142. Dang said the security and medical category is further divided into two seperate areas.
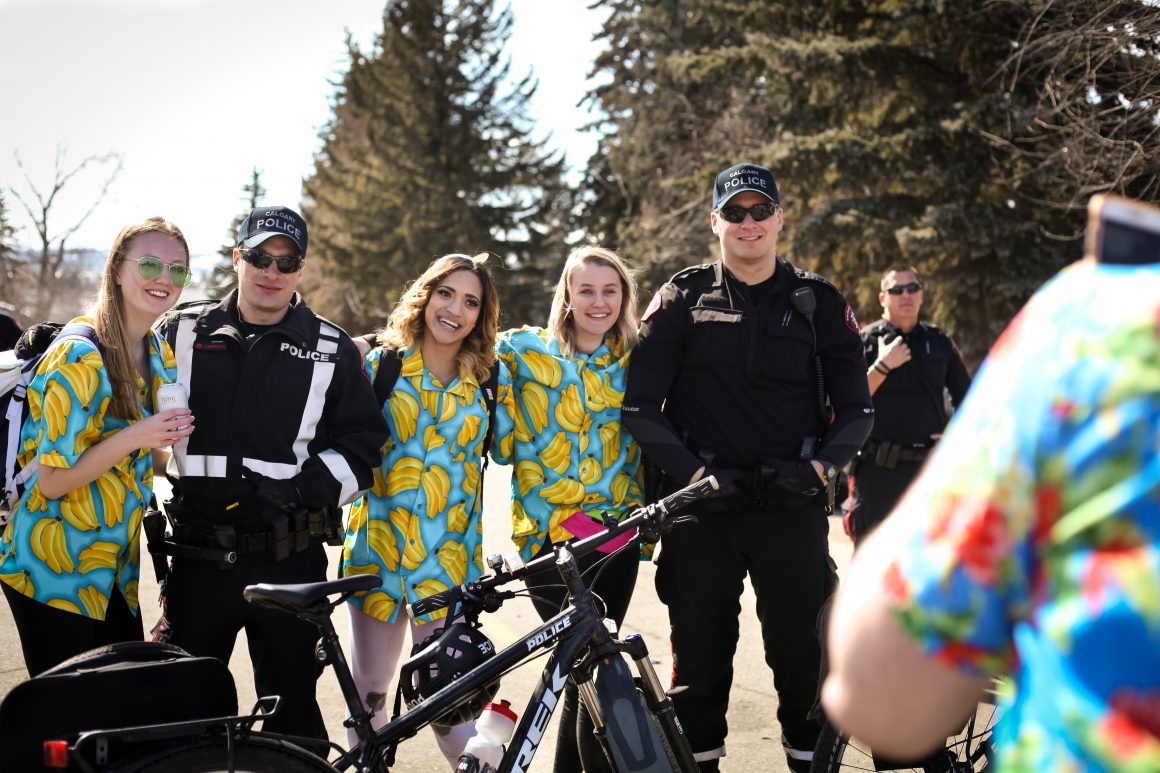
“The first part is what’s in the footprint itself, so inside the event where they looked at your bracelet,” Dang said. “Within the area of BSD we have security in there. We have Calgary Police Services (CPS), the contracted security and medical staff as well that we contract out.
“And then you have security and medical outside the actual event area or event footprint,” he continued. “There, we also have CPS patrols going around — we have campus security, things like that.”
The second largest expense category is facilities, amounting to 26 per cent of expenses or approximately $39,874, which Dang said included things like porta-potties, hand-wash stations and heaters to mitigate potentially cold temperatures.
Coming in at 11 per cent of total expenses or approximately $16,870, the parking services category included paying the fee of every parking stall in Lot 32 — where the BSD event is hosted — snow removal and removing the concrete wheel stops in each stall.
The concert category took a similar share of the total expenses, which includes the performing artists and staging.
“Miscellaneous was random things, like a bottle opener or something,” Dang said about the smallest category, taking up one per cent of total expenses or approximately $1,534.
The $54,712.96 in revenue came from drink sales, “other revenue” and ticket sales. BSD 2018 was the first BSD event where students were charged to attend. The charge was $5 per student in advance or $10 per student in-person.
“Other revenue — which was $1,861.20 — accounts for things like having the food trucks there. We get a portion of revenue from them,” Dang said. “And other small things like that.”
Bermuda Shorts Day 2018 saw lowest attendance in at least six years
A total of 5,248 wristbands were sold for BSD 2018 and 4,950 of those wristbands were claimed. It is a sharp decline from 8,880 wristbands claimed in 2017 and 9,684 wristbands claimed back in 2013. Actual attendance in the beer gardens has always been lower than wristbands claimed. Nevertheless, the rate of beer garden attendance compared to wristbands claimed was higher in 2018 than in 2017, likely due to the newly implemented cost of entry.
“Definitely there’s a drop this year. However, if you do look at the percentages of the rate of attendance, it is rather high at 85 per cent,” Dang said. “In short, the people who are buying the wristbands are going to the event.”
That being said, the 85 per cent figure given by Dang is the percentage of beer garden attendees out of the 4,950 wristbands claimed. If you use the actual number of tickets sold instead, just shy of 81 per cent of students who purchased tickets actually entered the beer gardens.
Revenue from tickets totaled to $24,584.51. Of the 5,248 wristbands sold, 3,876 were pre-sale tickets at the $5 price point, amounting to $12,440.11 of the revenue, while 1,372 were in-person sales at the $10 price point, amounting to $12,144.40 of the revenue.
Despite the $5 price tag, the SU only netted $3.08 per ticket. This is due to two fees paid by the SU: a service fee of $1.50 per ticket and a credit card processing fee of $0.42 per ticket.
The $10 in-person sales netted the SU $9.16 per ticket, due only to a $0.84 credit card processing fee.
The expense for making the wristbands cost the SU approximately $3,067, or about 12 per cent of the $24,584.51 ticket revenue.
Drink sales running dry
Gross bar sales at BSD 2018 totaled to $28,267.24. That’s down from $46,736.20 in 2017, $67,402.50 in 2016, $74,963.50 in 2015 and $91,470.25 in 2014.
“What you definitely notice upon looking at this real quickly is that we’re selling less drinks,” Dang said. “As you can see, students are, for whatever reason, drinking less. Or buying less at least. Drinks sold per person has decreased from 2.7 in 2013 to 1.3 in 2018.”
Back in 2017, the SU offered juice in addition to alcoholic beverages in the BSD beer gardens, netting them $114.
So what’s the future of BSD?
The final result of the SU’s revenues and expenses for BSD 2018 was a loss of $98,646.87. According to Dang, the SU is in the early process of discussing changes moving forward.
“ ‘Where are we lacking, where can we improve?’ We’re really just starting those discussions,” he said. “But definitely as we’re having those conversations more frequently, people will find out and we’ll tell you guys more about it.”
Dang also highlighted that student needs and interests are always a consideration for the SU.
“I just want to let people know that we do act as stewards of student money, especially in my role, but in that role and being a steward of student money, we have to be spending responsibly and [make sure] that we’re also addressing needs of students,” Dang said. “It makes me want to make sure students have a place to celebrate end of classes and make it more sustainable.”